
Two Qwen3 Models on One DGX Spark: The Residency Math for Local LLM Setup
The residency math, the gpu_memory_utilization trap, and what to verify first. Notes from my experiments with local LLMs.

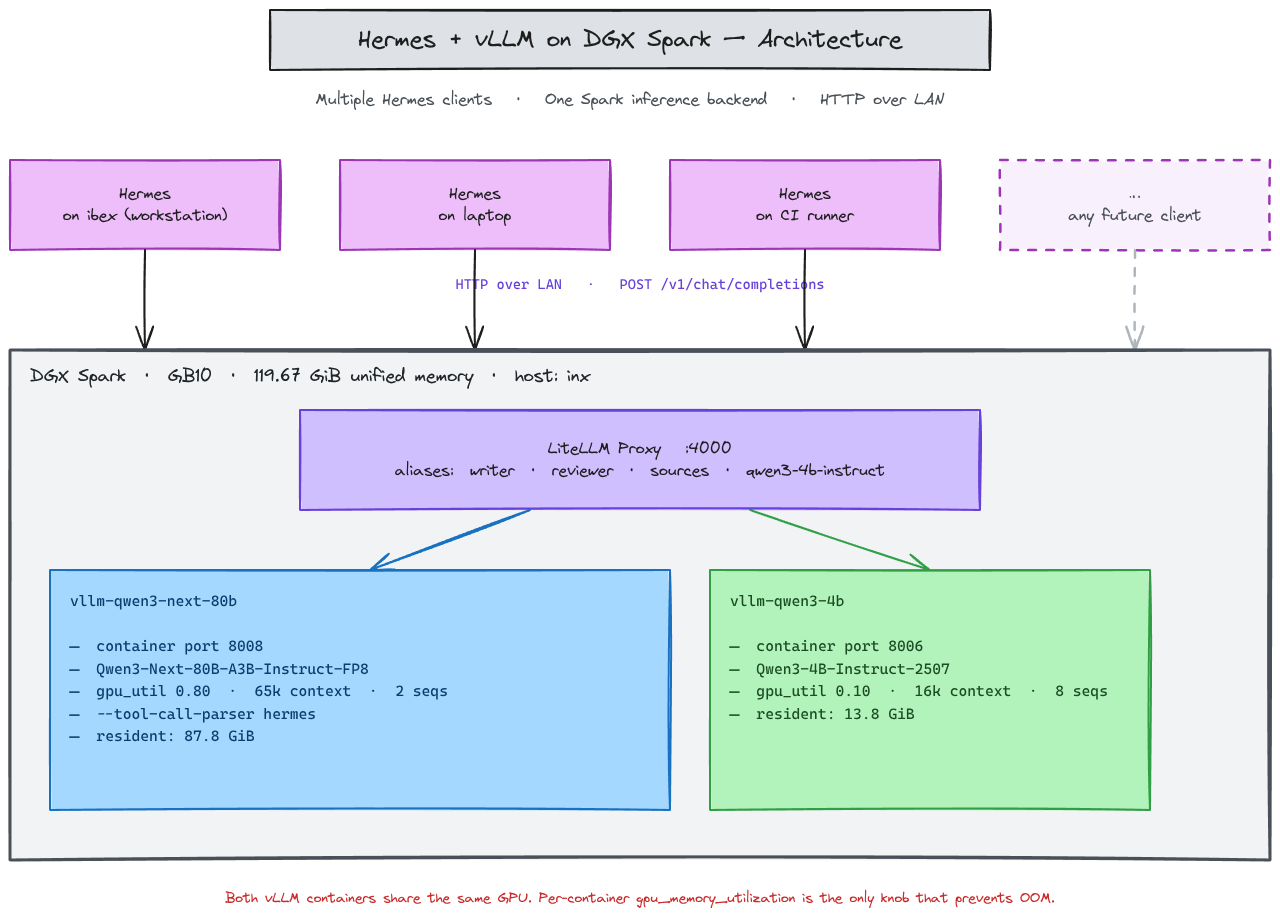
My agent stack with Hermes runs on a workstation. The models run on a DGX Spark on the same LAN. The split is deliberate: the workstation stays responsive, the Spark does the GPU work, and they talk over an HTTP proxy.
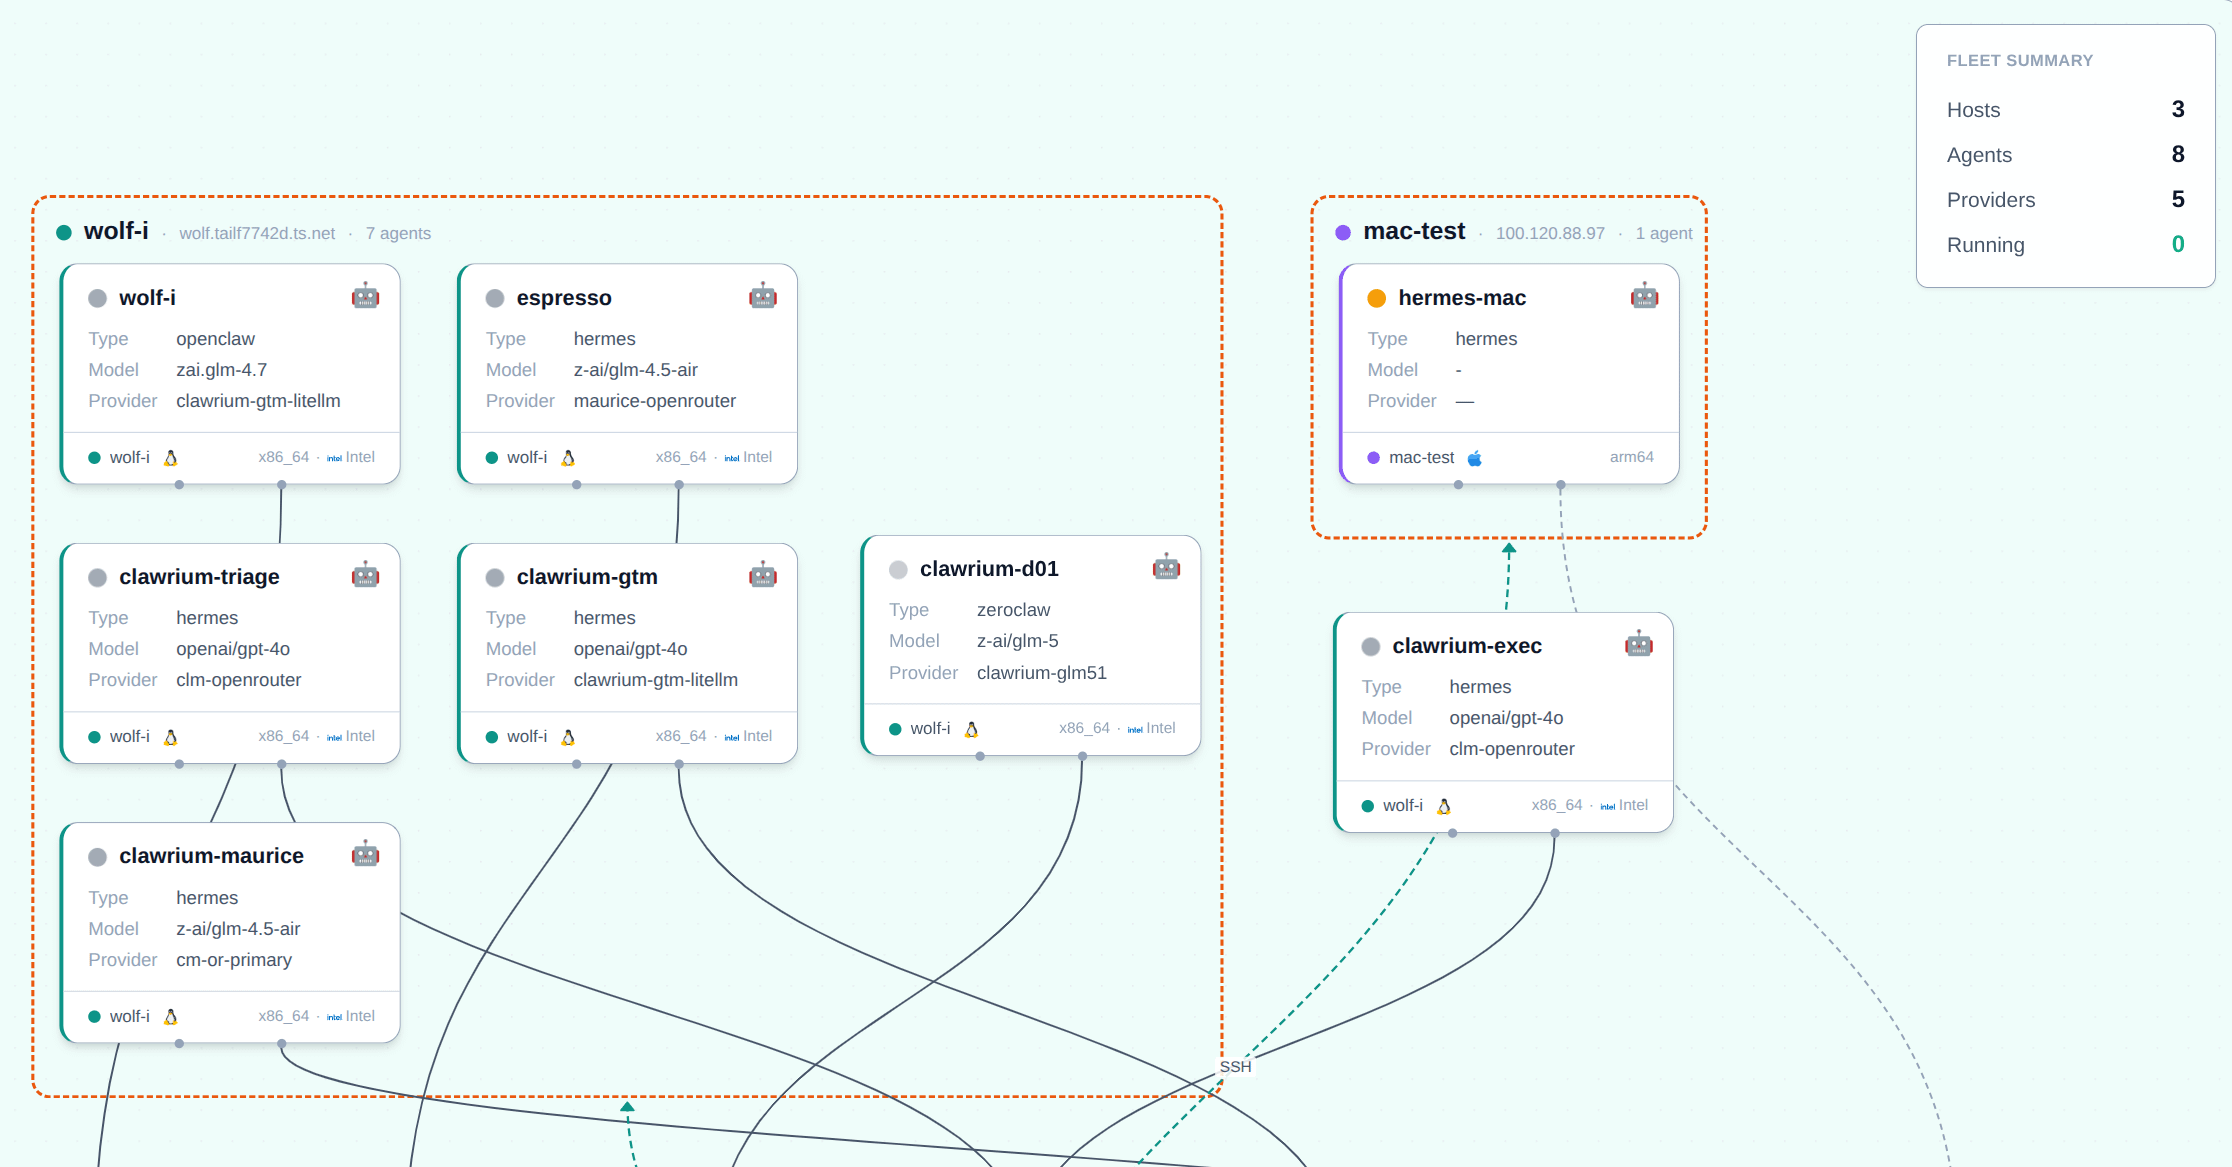
Since I started managing the agent fleet through Clawrium, the Hermes count has climbed. More agents on more hosts, more concurrent traffic, all hitting the same Spark. What was a one-laptop, one-model setup is now a small fleet against a single backend — and the shape of the load is exactly what a single-model server can’t serve.
The Spark served models through ollama for months. It worked. One model up, single config, easy to bring down.
But ollama owns the card. There’s no per-process memory budget, no gpu_memory_utilization knob, no straightforward way to coresident a heavy model for reasoning and a fast model for quick turns. KV cache management is whatever the underlying llama.cpp backend gives you. PagedAttention isn’t there.
vLLM fixes all of that.
PagedAttention reclaims KV blocks instead of contiguous-pinning them.
gpu_memory_utilizationgives you a per-container budget.
One Spark (GB10, 119.67 GiB unified memory) can run multiple vLLM containers behind a LiteLLM proxy on :4000, and Hermes hits one URL to route to either model. The promise: serve Qwen3-Next-80B-Instruct-FP8 for the heavy work and Qwen3-4B-Instruct-2507 for fast turns, coresident, both reachable from a single endpoint.
That’s the why. What follows is what it took to make the promise hold.
Spark hardware will happily hold two Qwen3 models if the numbers line up. They didn’t, for several days. That’s where my last weekend went.
Attempt one: trust the target
First 80B config: gpu_memory_utilization: 0.75, max_model_len: 65536, max_num_seqs: 4. vLLM’s KV cache init crashed with “No available memory for the cache blocks.” Qwen3-Next is mostly Mamba; the per-block page alignment pushes KV pool demand higher than the ~14 GiB residue after weights.
Bumped to 0.85. Now the free-memory check crashed: “Free memory on device (98.51/119.67 GiB) is less than desired GPU memory utilization (0.85, 101.72 GiB).” The 4B was already resident at ~16 GiB. The 80B’s 0.85 target was reading the whole card, not what was free.
That’s the first lesson. gpu_memory_utilization is a fraction of total GPU memory, not free memory.
Two co-resident vLLM processes need their fractions to sum below ~0.95 to leave room for CUDA framework overhead. If your math assumes free, you’ll oscillate between OOMs and silent KV starvation.
Settled at 0.80 / 32k / 2 for the 80B. Loaded clean. KV pool ~20.8 GiB after weights.
Attempt two: point Hermes at it
Then Hermes came online and tool calls came back as plain text. <tool_call> JSON sitting inside content. tool_calls: []. finish_reason: stop. Hermes never executed it.
A day of parser triage produced nothing actionable. Both hermes_tool_parser.py and qwen3xml_tool_parser.py look for <tool_call> (singular). The <tools> plural tag is the system-prompt definition, not the output. The parser wasn’t wrong. The model wasn’t emitting.
tool_choice: "required" worked. tool_choice: "auto" came back empty: tool_calls: [], content: "", 619 characters of reasoning inside <think> concluding “Alright, that’s it” without emitting the call.
Qwen’s own model card states it plainly: Qwen3-Next-80B-Thinking supports only thinking mode. enable_thinking: false is a structural no-op on this checkpoint. /no_think in the prompt is ignored. The model reasons inside <think>, decides, and never emits.
That’s an unrecoverable failure for any agent SDK that defaults to tool_choice: "auto". The fix wasn’t a parser flag. It was swapping the whole 80B backbone from Thinking to Instruct.
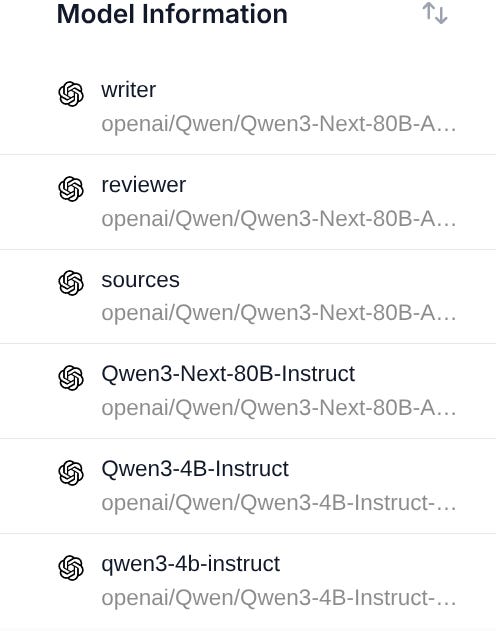
77 GiB pre-pull. Drain GPU. Bring up with --enable-auto-tool-choice --tool-call-parser hermes, no --reasoning-parser. Three LiteLLM aliases (writer / reviewer / sources) all passed tool_choice: "auto" cleanly with finish_reason: tool_calls. Trade accepted: reviewer loses native <think> traces. Reasoning moved into the prompt.
Attempt three: the bump that broke coresidency
Reviewer agent (running on Hermes) needed 64k context. Bumped the 80B to 0.85 / 65536 / 2. 80B loaded healthy. The 4B’s restart loop kicked in 19 times: “Free memory on device (12.58/119.67 GiB) is less than desired GPU memory utilization (0.12, 14.36 GiB).”
80B’s actual residency at 0.85 was 101.5 GiB. Plus ~5 GiB CUDA framework overhead. That left ~12.5 GiB free. The 4B needed 14.36 GiB. No room.
Toned the 80B back to 0.80, dropped the 4B to 0.10 / 16384 / 8. Both came up healthy. The 4B’s max_model_len had to drop because the 0.10 allocation leaves only ~3.5 GiB for KV pool — 32k single-seq KV demand (~4.8 GiB) doesn’t fit; 16k (~2.4 GiB) does.
The residency math
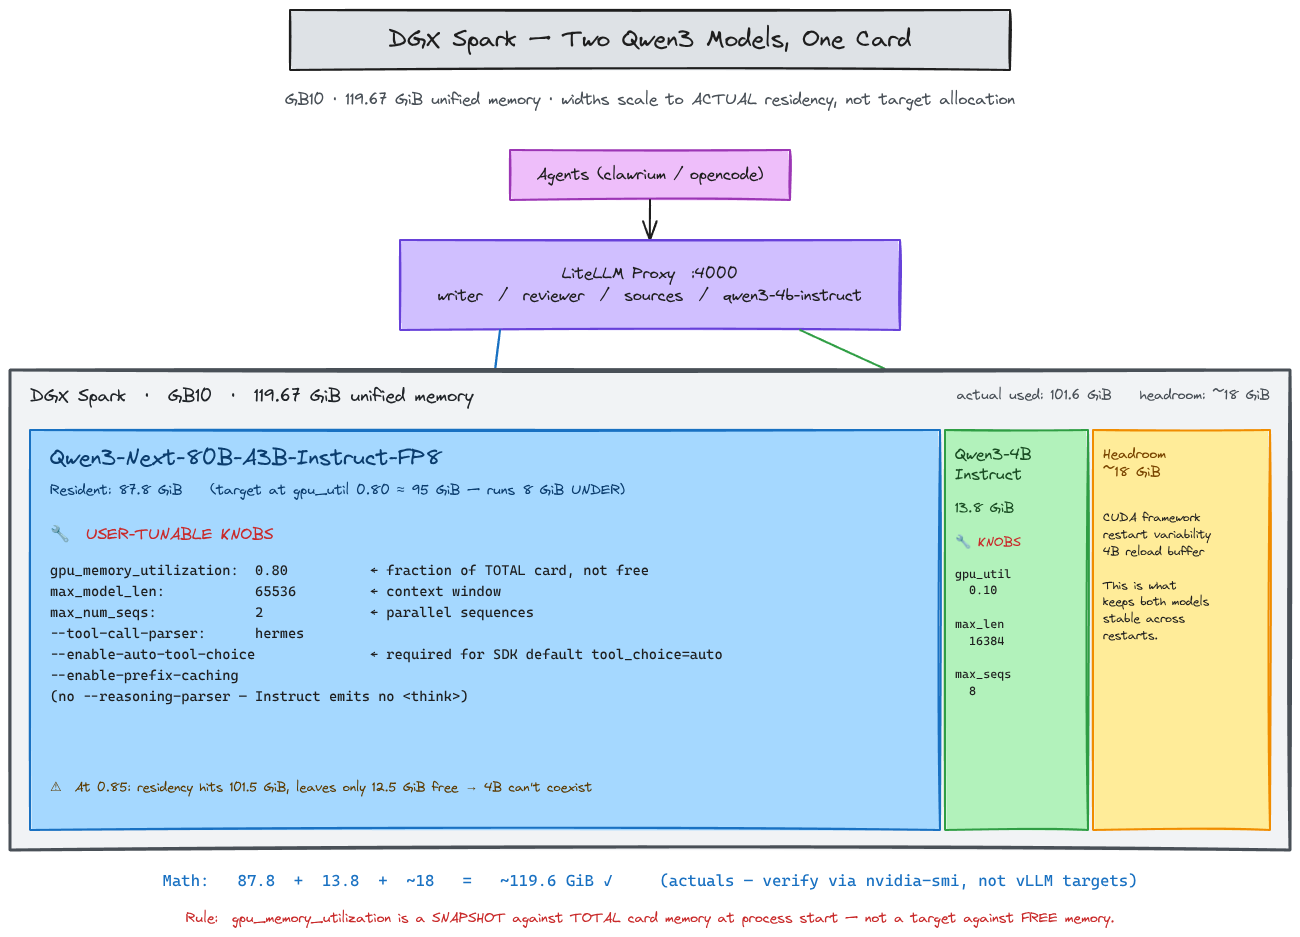
This is the table I wish I’d built on day one:
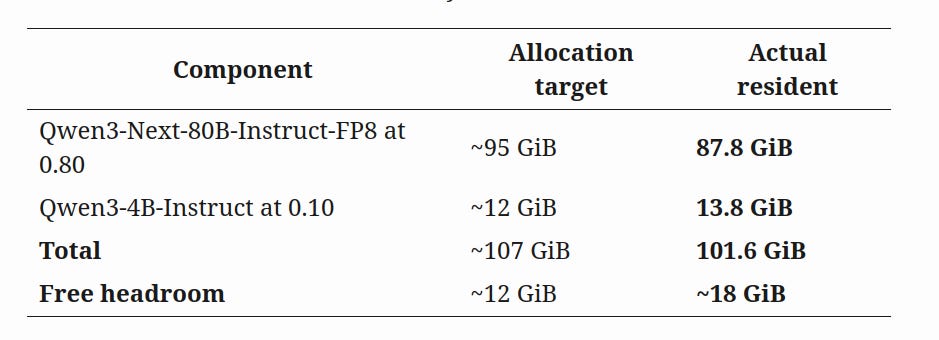
Three observations from the actuals.
The 80B’s actual residency at 0.80 ran 8 GiB under allocation. That cushion is the only reason the 4B’s restart variability doesn’t break the deployment. At 0.85, the cushion went negative — same hardware, same models, same vLLM build.
The 4B at 0.10 actually resides at 13.8 GiB, not the 12 GiB the target implies. CUDA framework overhead doesn’t disappear at small allocations.
On Qwen3-Next specifically, max_model_len × max_num_seqs is dominated by Mamba state alignment, not attention KV. Halving max_model_len doesn’t halve KV pool demand the way it does on a pure attention model. Plan KV against Mamba page sizes, not against intuition from Llama-class models.
Once the wiring was complete, LiteLLM showed all the aliases for the same two models running on the spark.
The insight
gpu_memory_utilization is a snapshot vLLM takes at process start, against total card memory. It is not a target against free memory. CUDA contexts from prior failed attempts can transiently inflate residency and trip the check spuriously. Co-resident processes don’t negotiate — they race.
The only number that matters is actual residency after both processes have stabilized, measured against the headroom the harder-to-restart model needs to come back from a crash. Target allocations are a planning input; actuals are the ground truth.
For a two-model Spark deployment, the playbook is: load the bigger model first, let it settle, run nvidia-smi to read actual residency, then size the smaller model’s gpu_memory_utilization against the free pool minus ~5 GiB for its own framework overhead. Recheck after both restart cleanly twice.
The 24-hour action
If you have a vLLM deployment running right now, pull this:
nvidia-smi --query-gpu=memory.used --format=csvCompare the actual number to what your gpu_memory_utilization target implies. If the two diverge by more than 10%, your sizing model is wrong. Fix it before you ship anything that depends on coresidency — agent stacks, parallel workers, fallback chains. The math has to be empirical, not aspirational.
If you’re standing up a similar local-LLM stack — DGX Spark(or other hardware), vLLM, multiple coresident models, or wiring a remote agent fleet to a single inference backend — I’d love to compare notes.